Home
-
Secondary structure
Comparative modelling
Contacts
Threading
-
search
-
FTP
-
Mirrors
-
Bottom
Explain scores
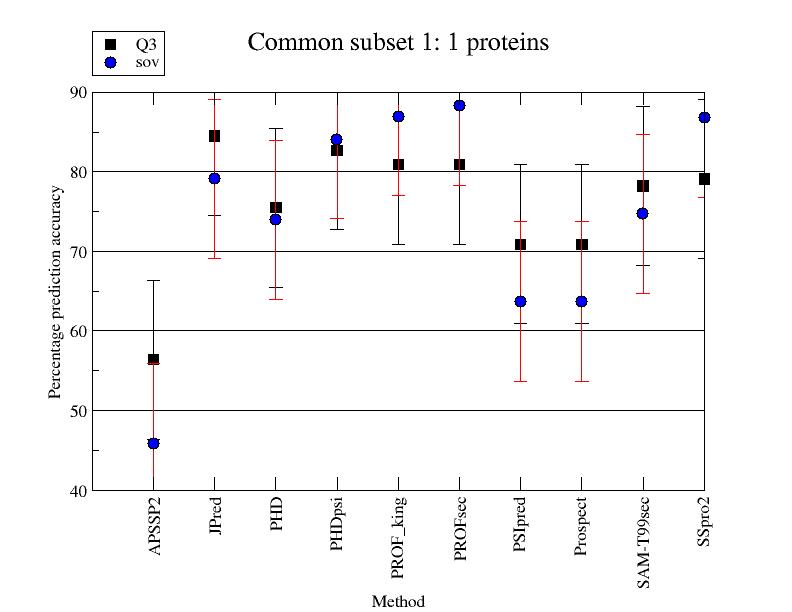
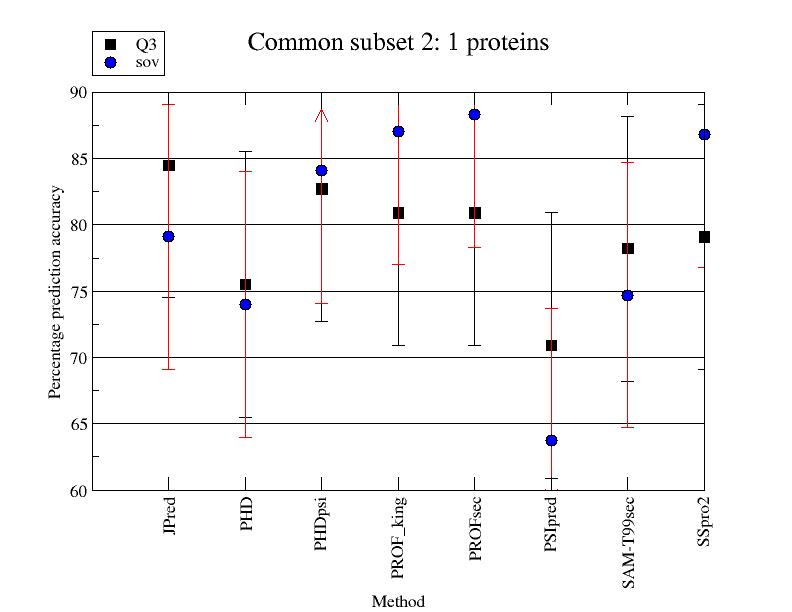
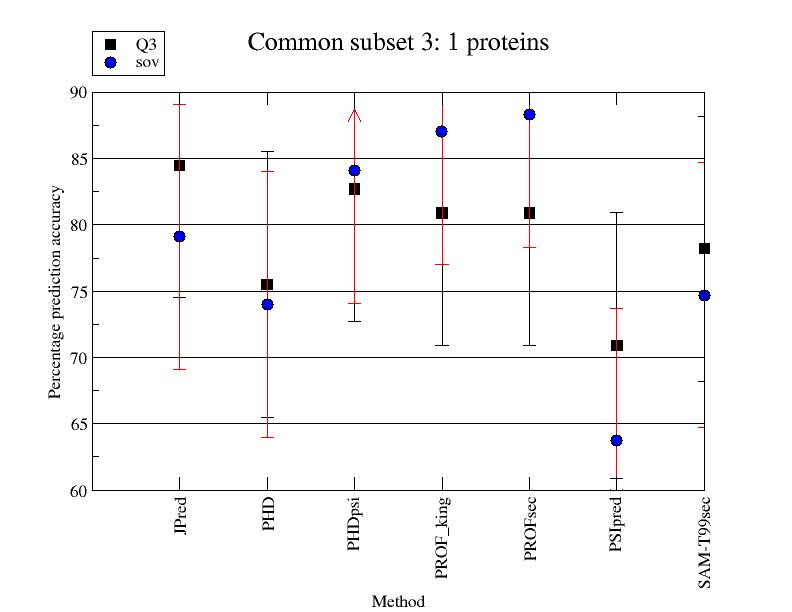
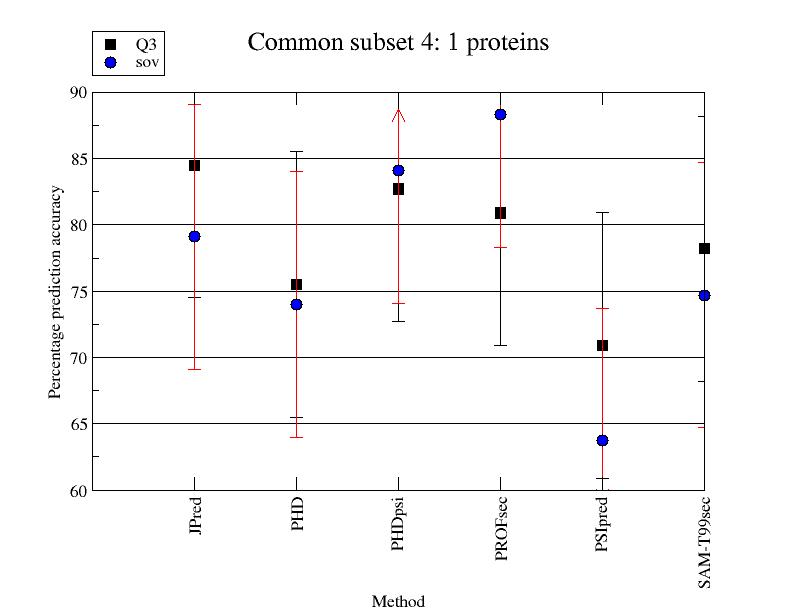
EVA secondary structure graphs
All graphs available:
All common subsets
(6 sets)
All methods per-month averages
(19 methods)
Particular graphs directly:
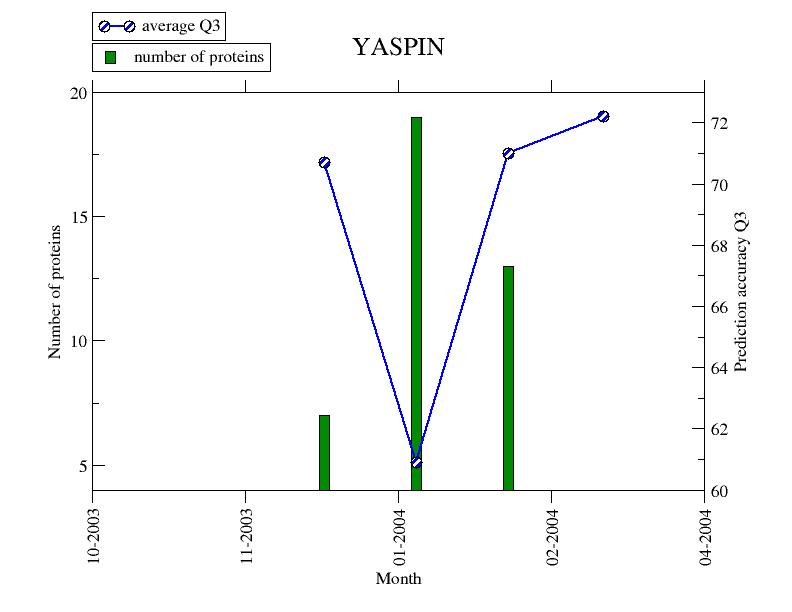
Note: numbers in brackets give number of proteins in respective graphs
Common subset 1
(1)
graph/common1.jpg
Common subset 2
(1)
graph/common2.jpg
Common subset 3
(1)
graph/common3.jpg
Common subset 4
(1)
graph/common4.jpg
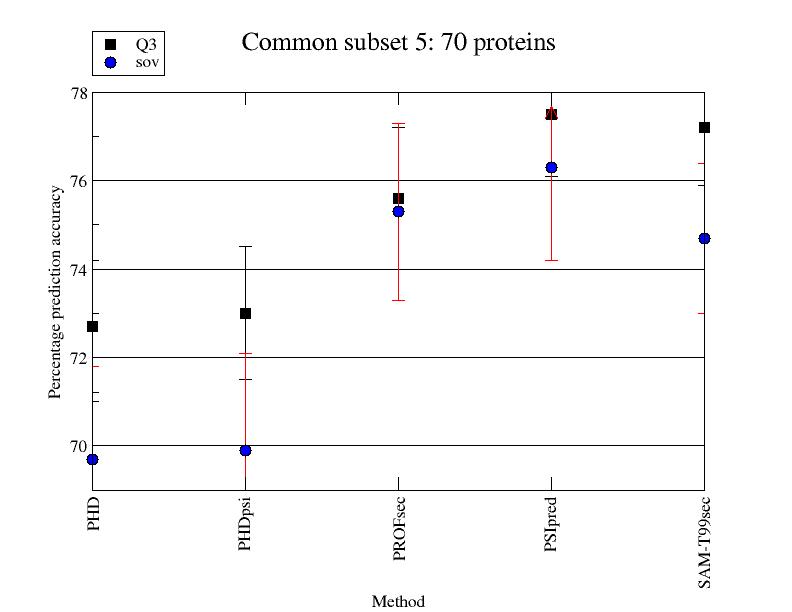
Common subset 5
(70)
graph/common5.jpg
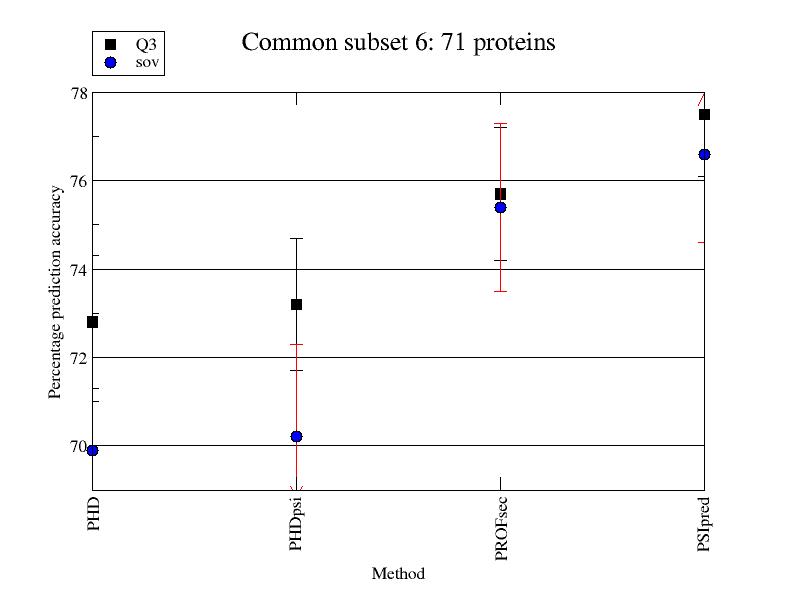
Common subset 6
(71)
graph/common6.jpg
Method
APSSP
(0)
graph/month_apssp.jpg
Method
APSSP2
(366)
graph/month_apssp2.jpg
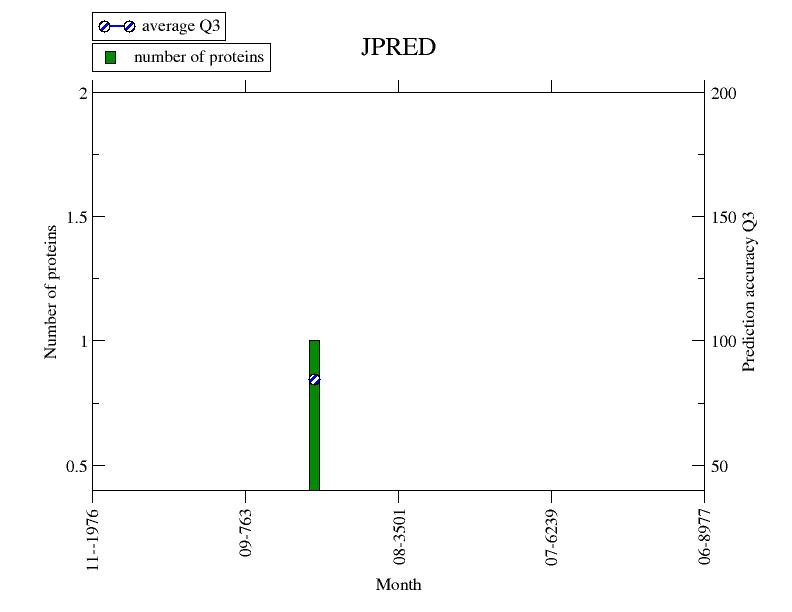
Method
JPred
(167)
graph/month_jpred.jpg
Method
JUFO
(133)
graph/month_jufo.jpg
Method
PHD
(373)
graph/month_phd.jpg
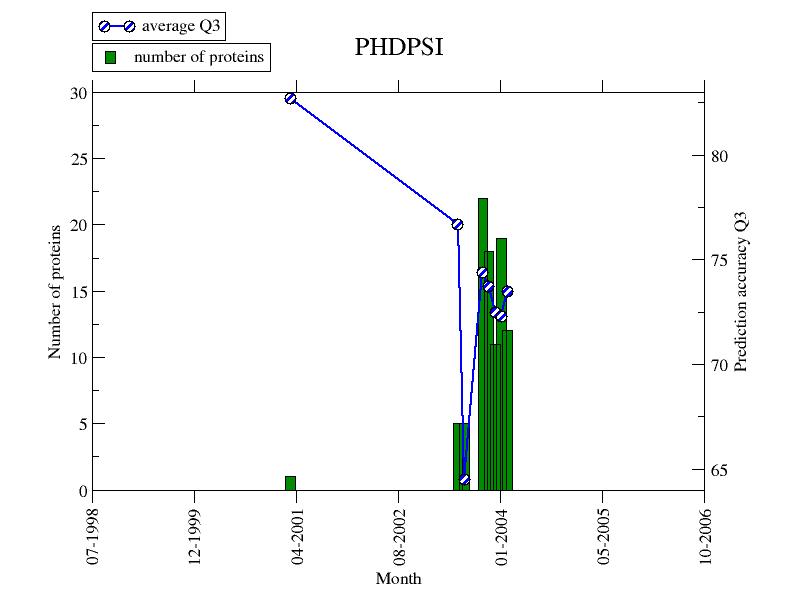
Method
PHDpsi
(370)
graph/month_phdpsi.jpg
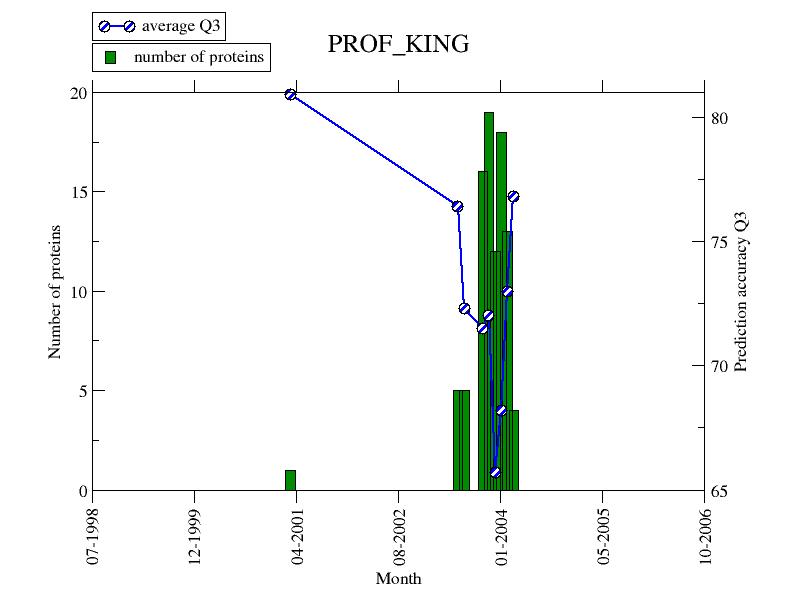
Method
PROF_king
(375)
graph/month_prof_king.jpg
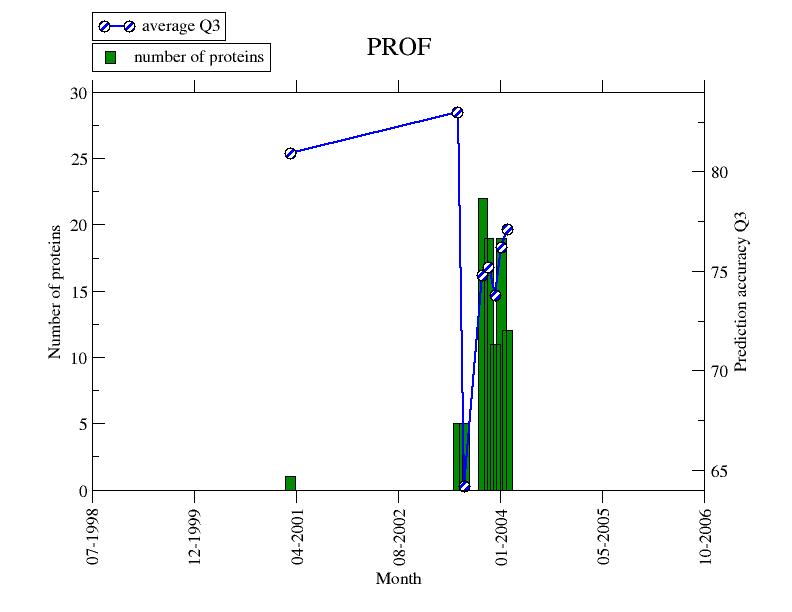
Method
PROFsec
(373)
graph/month_profsec.jpg
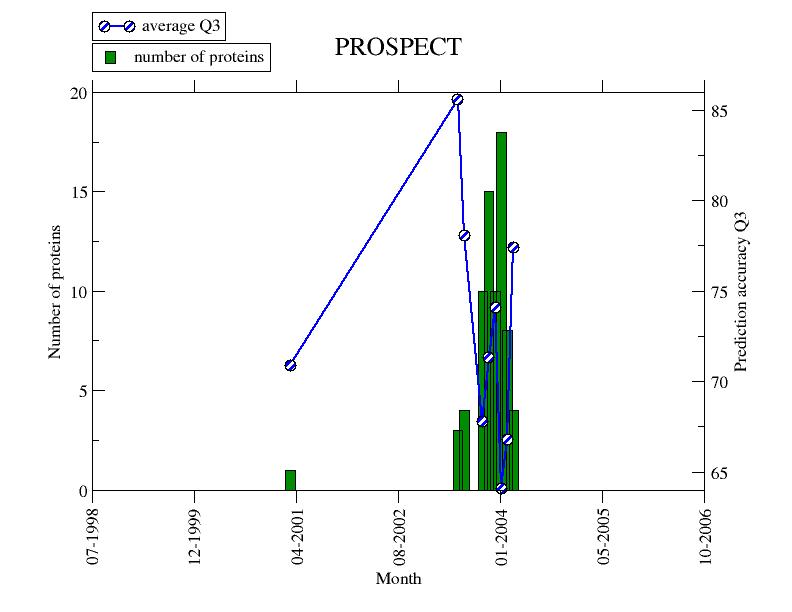
Method
Prospect
(286)
graph/month_prospect.jpg
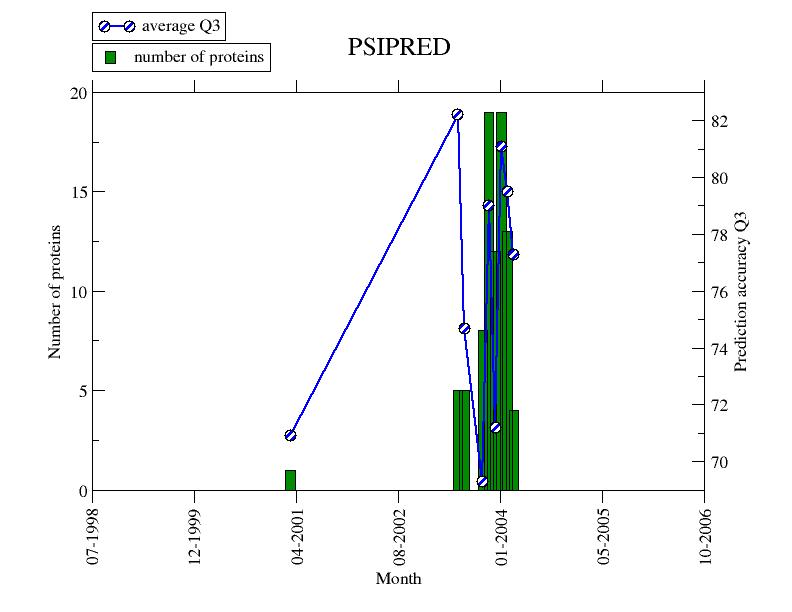
Method
PSIpred
(374)
graph/month_psipred.jpg
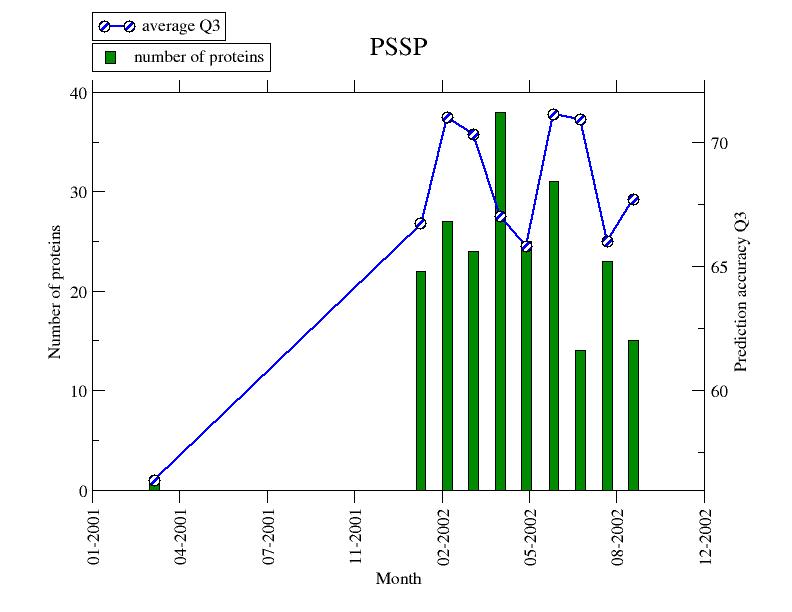
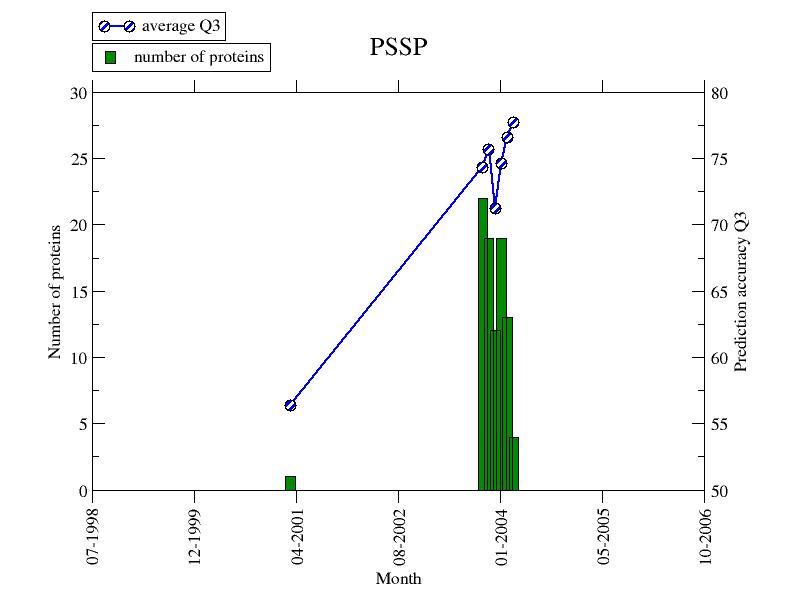
Method
PSSP
(1)
graph/month_pssp.jpg
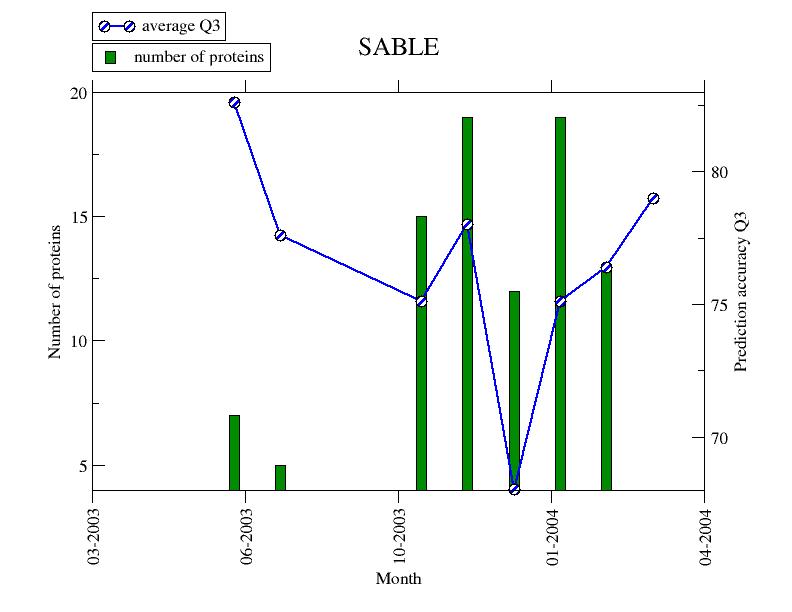
Method
SABLE
(87)
graph/month_sable.jpg
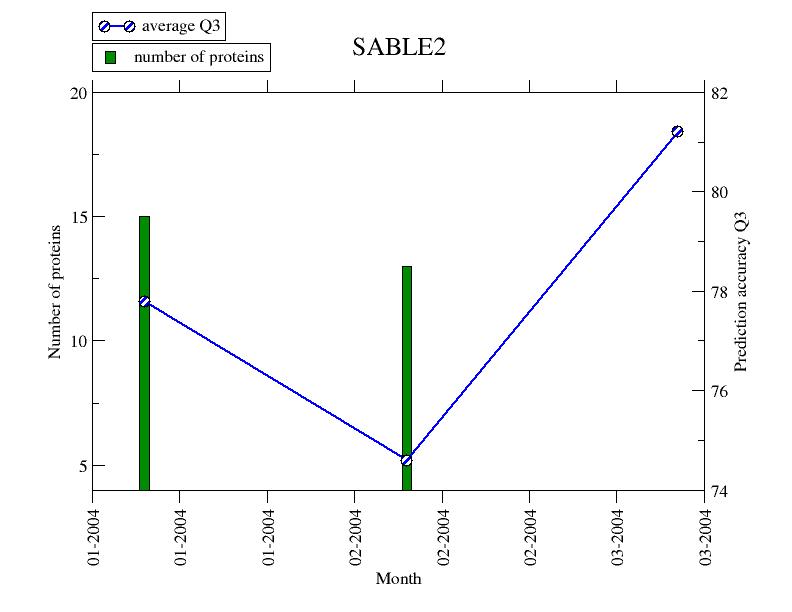
Method
SABLE2
(30)
graph/month_sable2.jpg
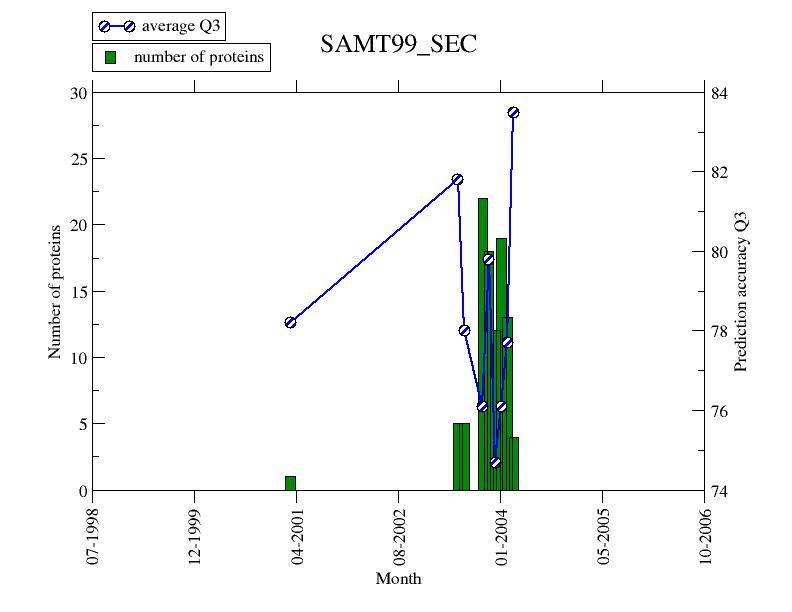
Method
SAM-T99sec
(329)
graph/month_samt99_sec.jpg
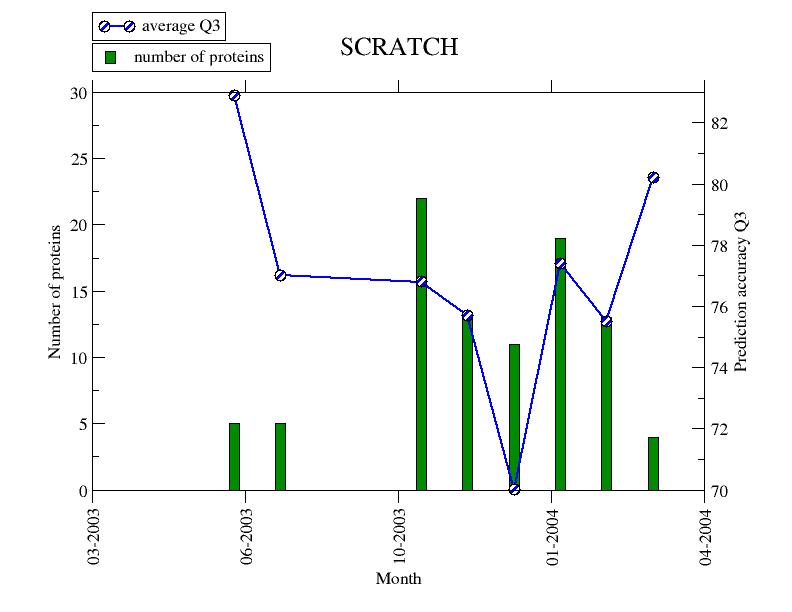
Method
SCRATCH (SSpro3)
(168)
graph/month_scratch.jpg
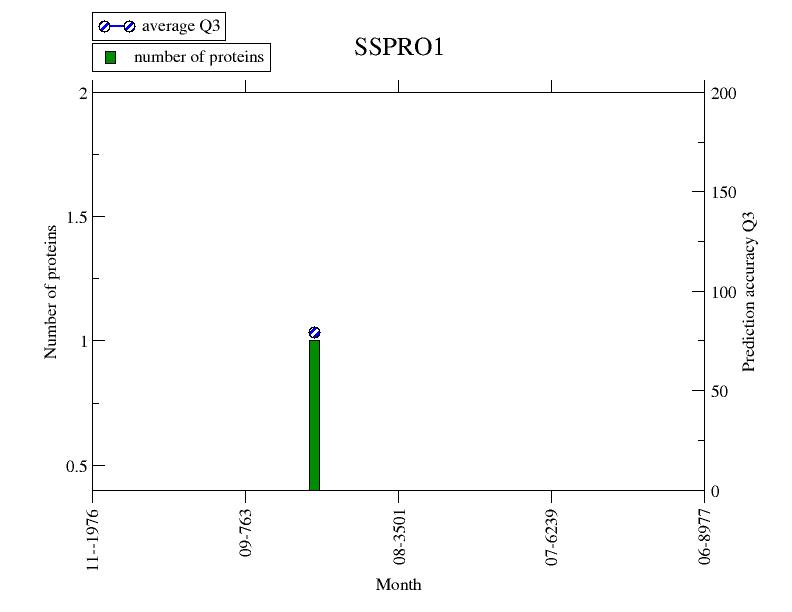
Method
SSpro1
(1)
graph/month_sspro1.jpg
Method
SSpro2
(257)
graph/month_sspro2.jpg
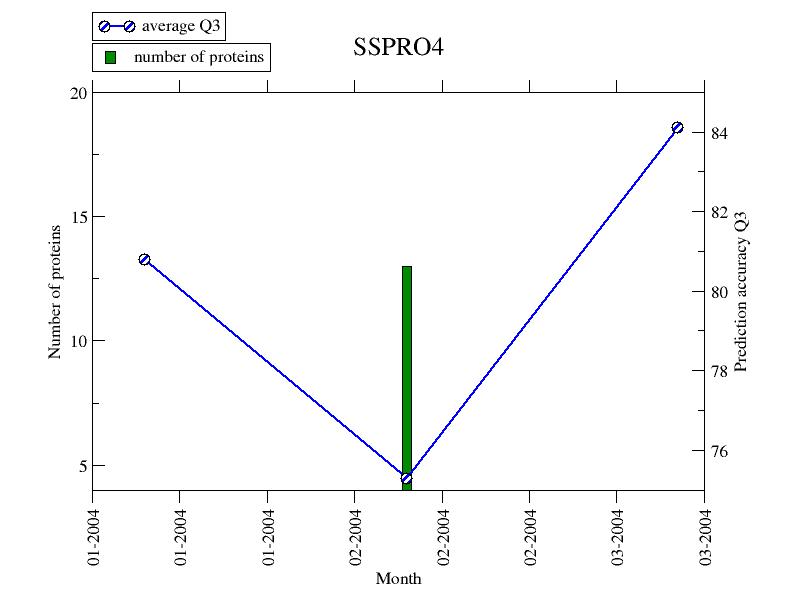
Method
SSpro4
(19)
graph/month_sspro4.jpg
Method
yaspin
(40)
graph/month_yaspin.jpg
Last update: Apr 28, 2004
Contact:
rost@columbia.edu
WWW:
http://cubic.bioc.columbia.edu/eva
Explain scores
-
Home
-
Secondary structure
Comparative modelling
Contacts
Threading
-
search
-
FTP
-
Mirrors
-
Top