APSSP
APSSP2
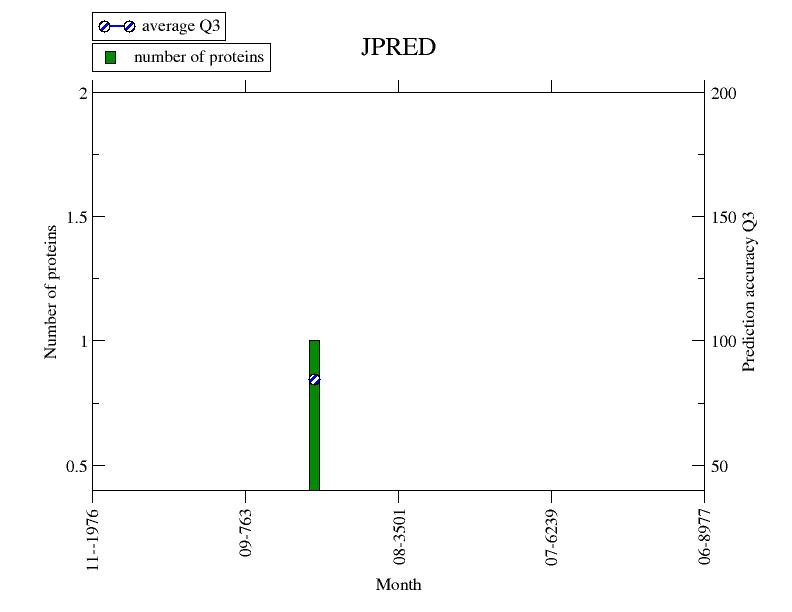
JPred
JUFO

PHD

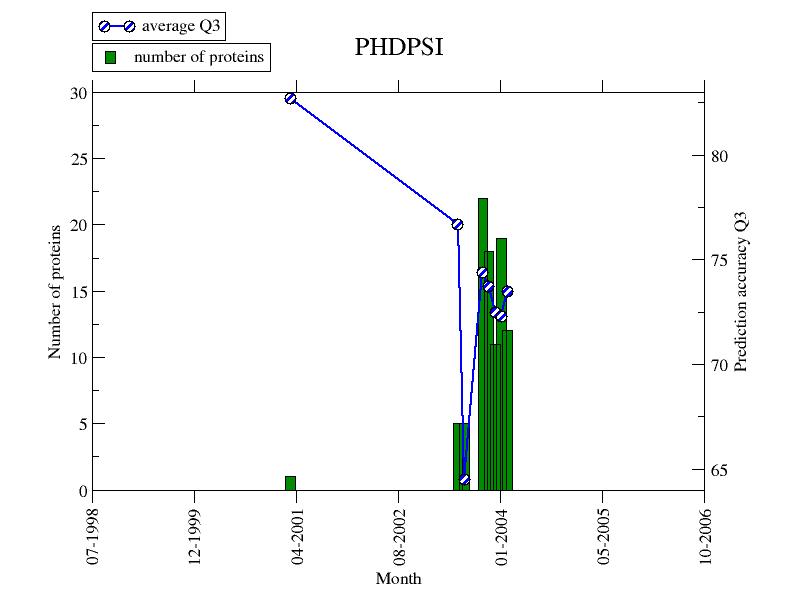
PHDpsi
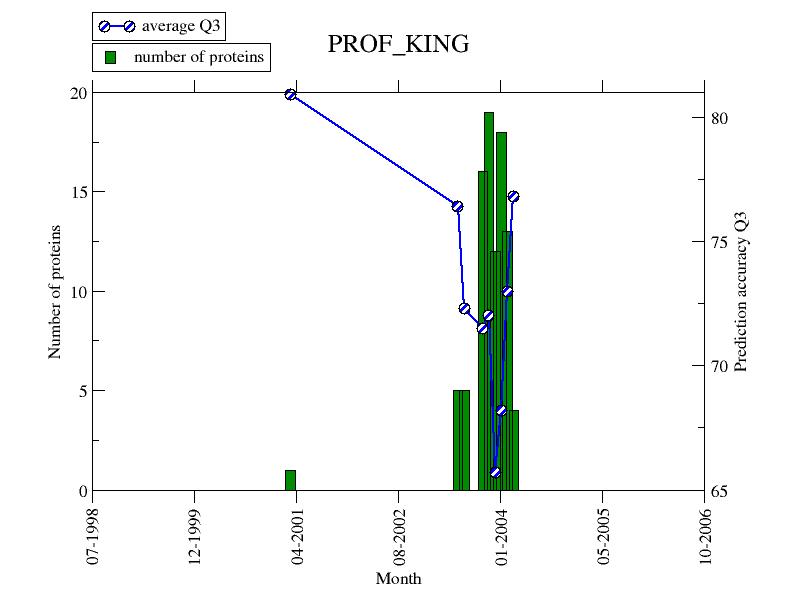
PROF_king
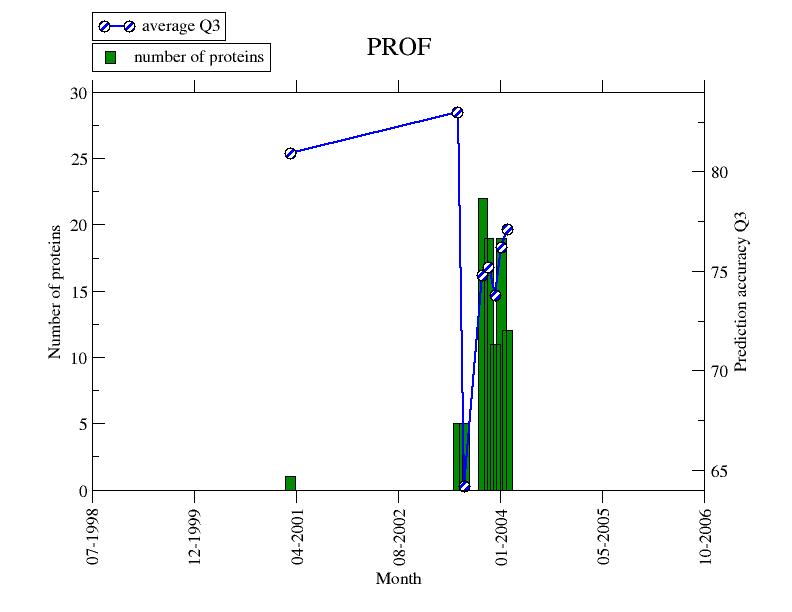
PROFsec
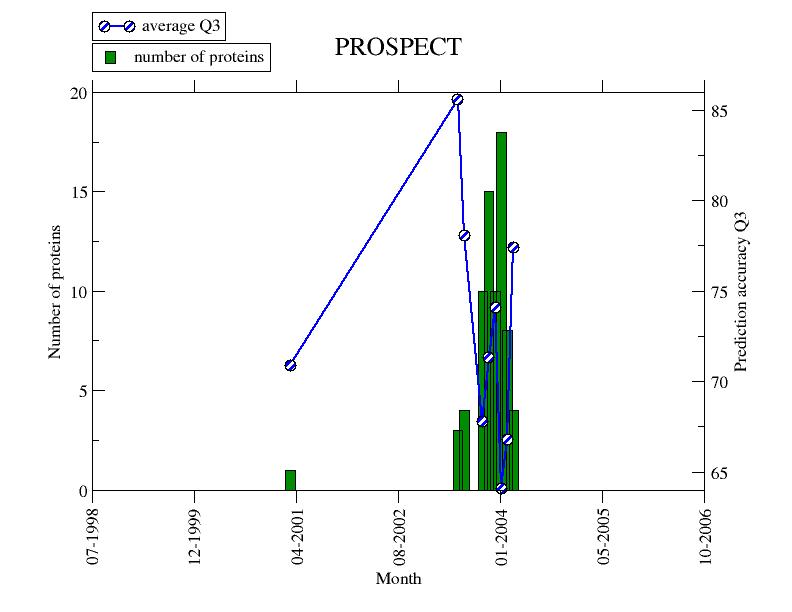
Prospect
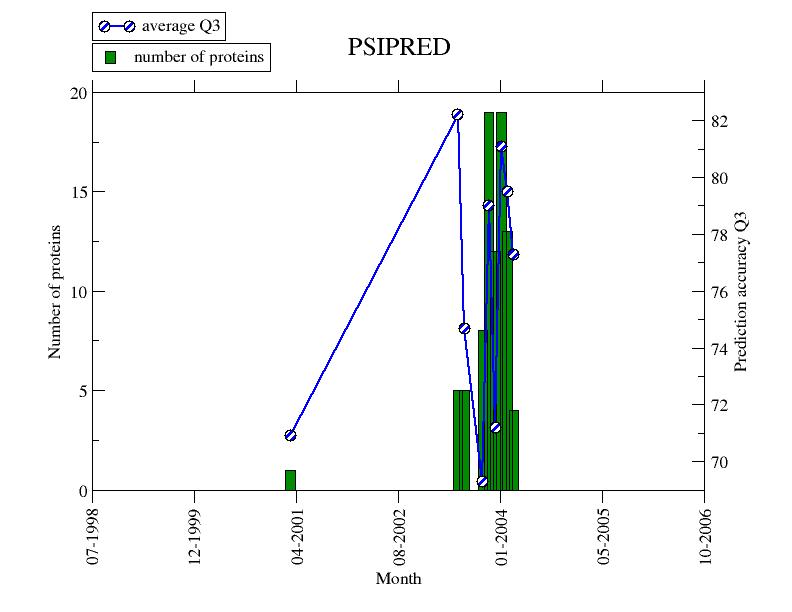
PSIpred
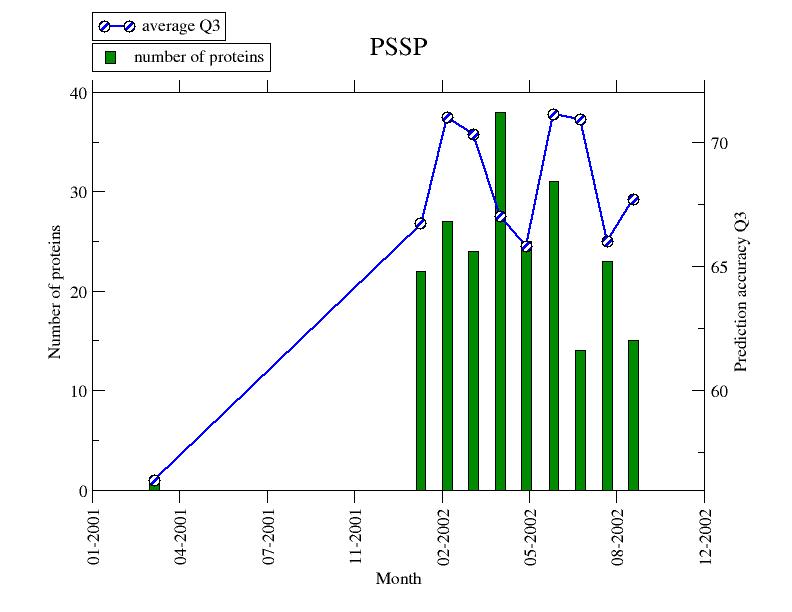
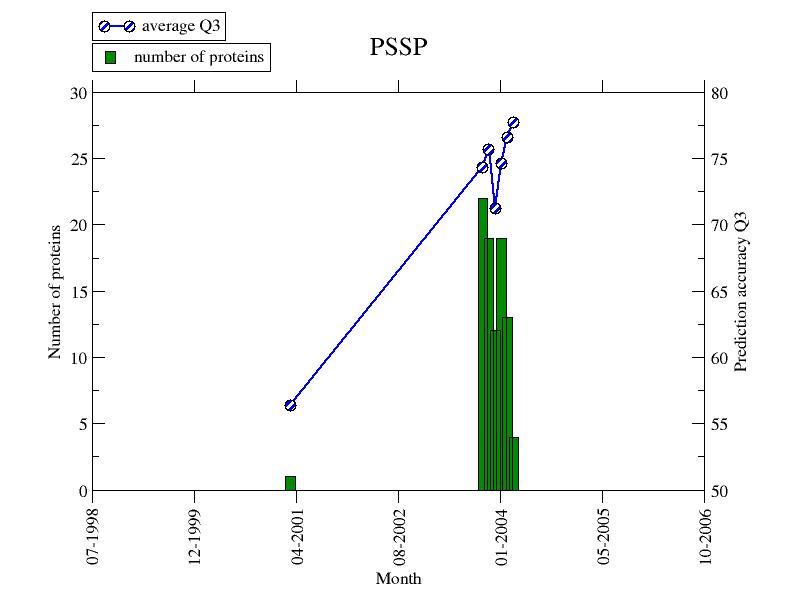
PSSP

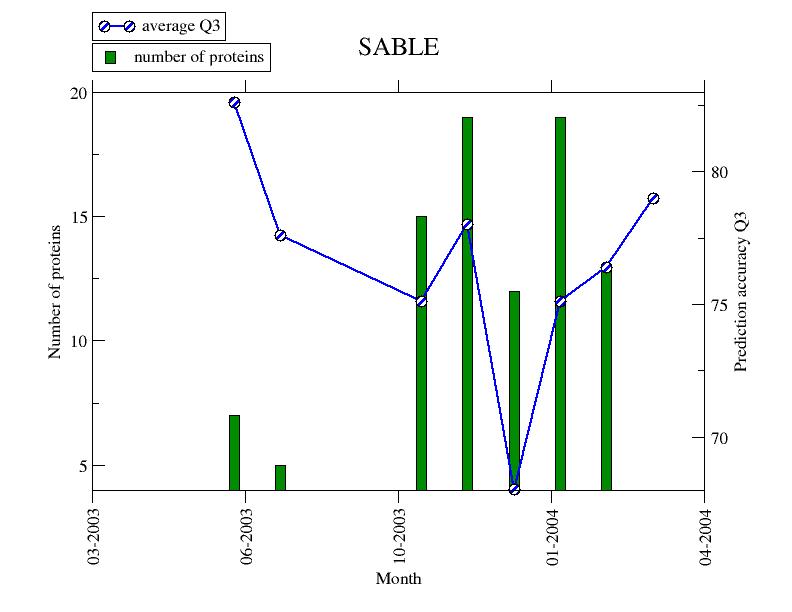
SABLE
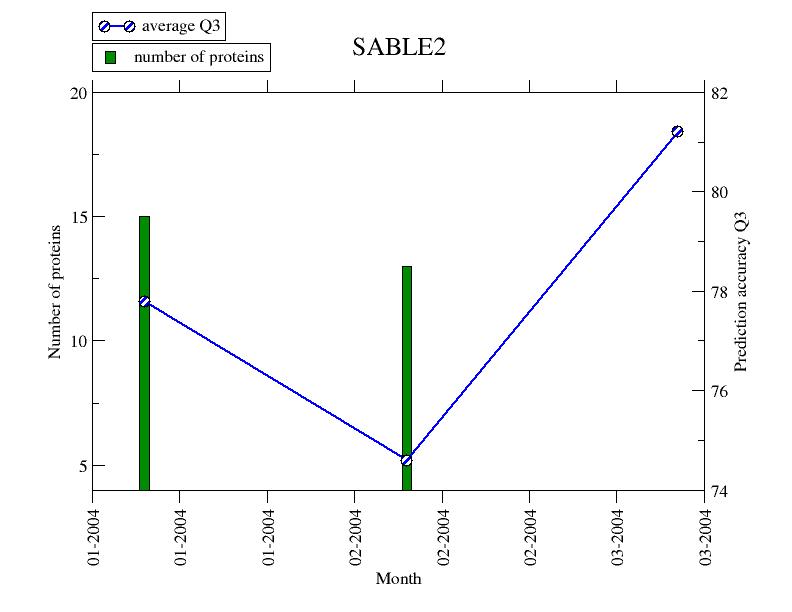
SABLE2
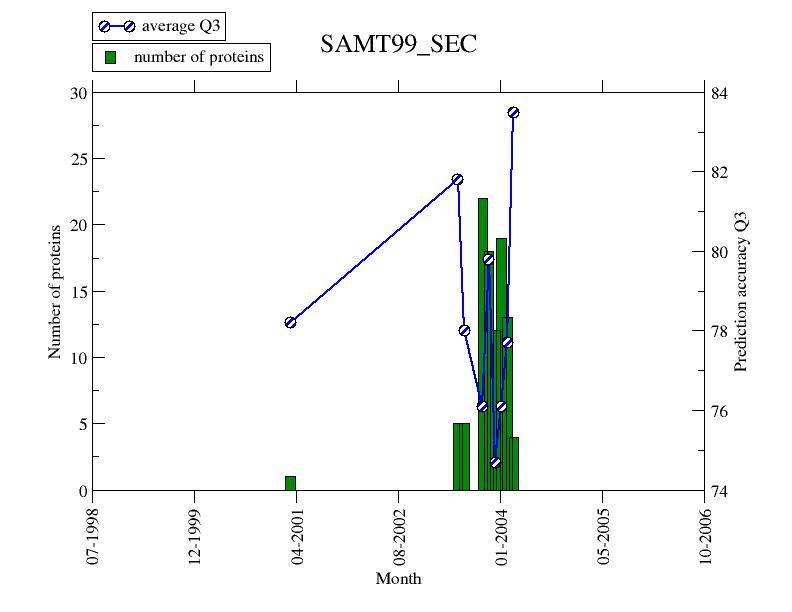
SAM-T99sec
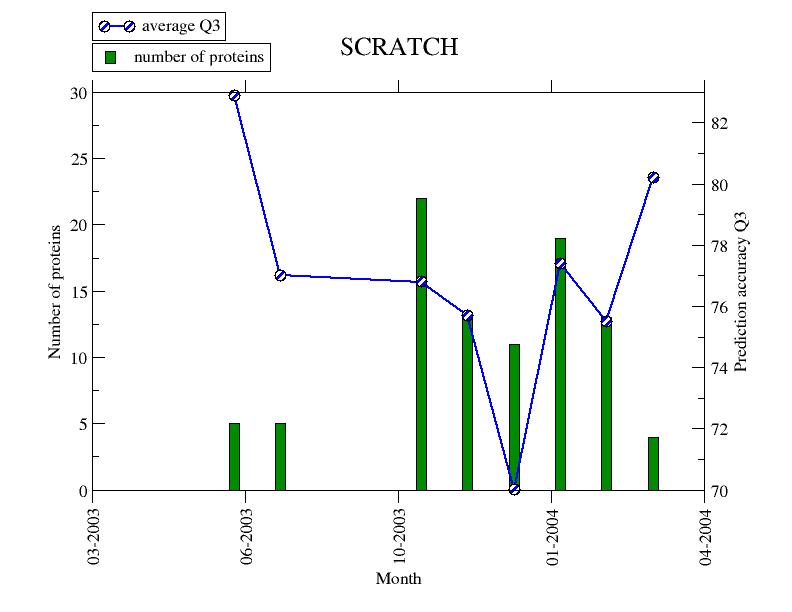
SCRATCH (SSpro3)
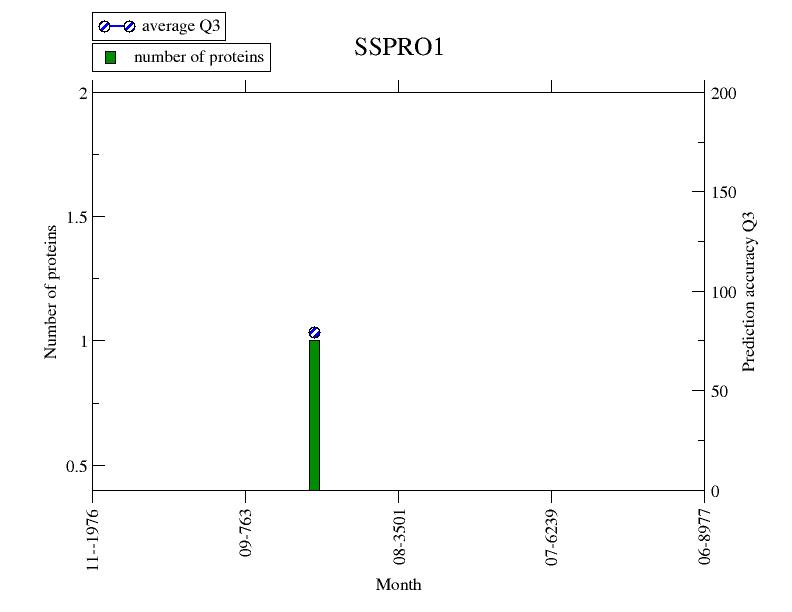
SSpro1
SSpro2

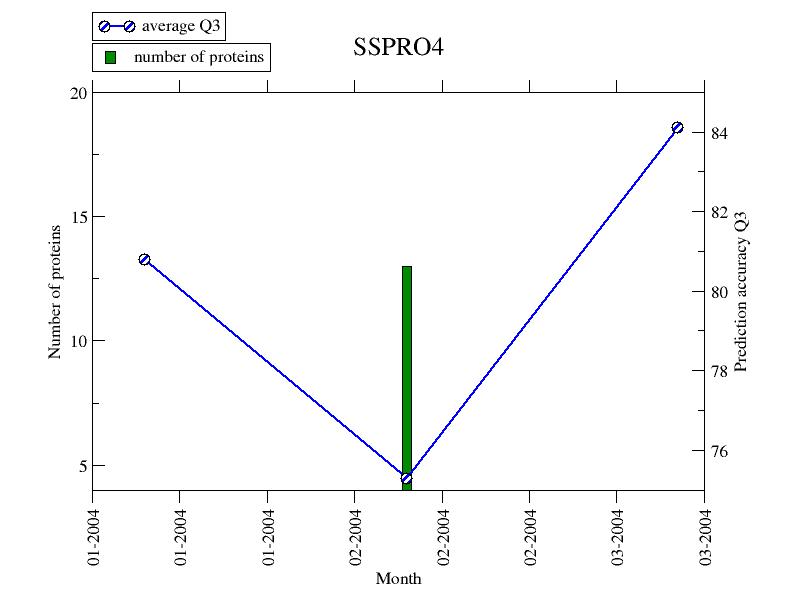
SSpro4
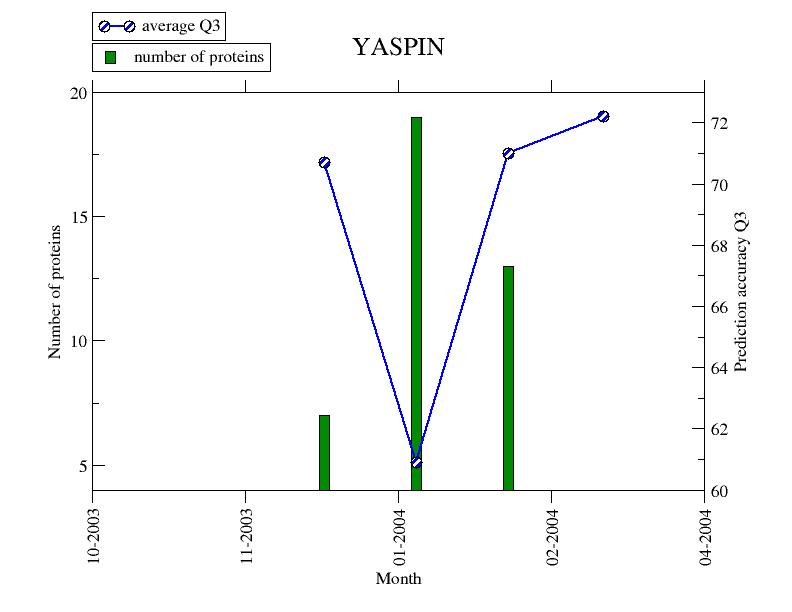
yaspin
|
APSSP |
APSSP2 |
JPred |
|
JUFO |
PHD |
PHDpsi |
|
PROF_king |
PROFsec |
Prospect |
|
PSIpred |
PSSP |
SABLE |
|
SABLE2 |
SAM-T99sec |
SCRATCH (SSpro3) |
|
SSpro1 |
SSpro2 |
SSpro4 |
|
yaspin |