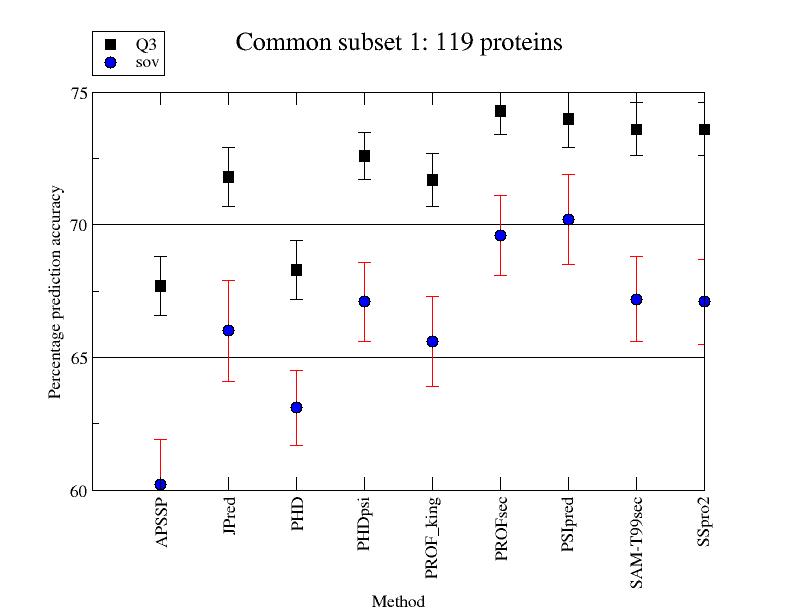
| Common subset 1 (30) | graph/common1.jpg |
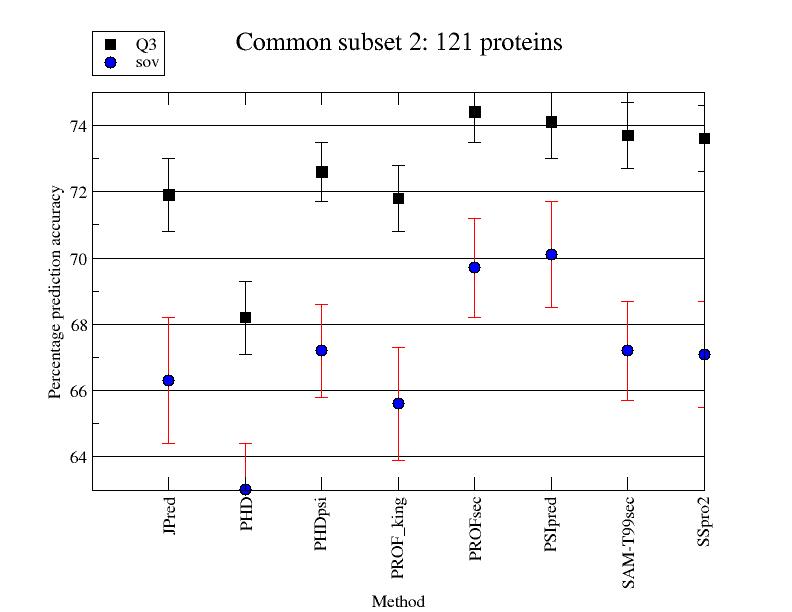
| Common subset 2 (134) | graph/common2.jpg |
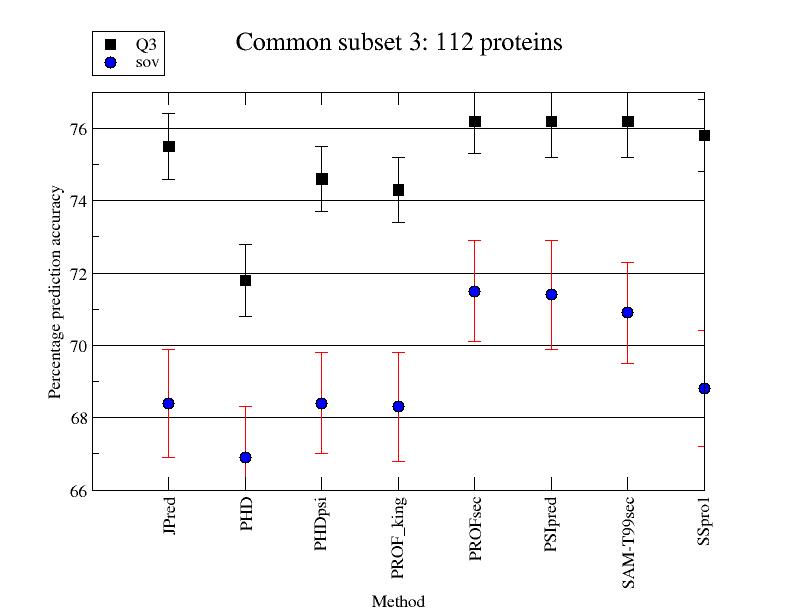
| Common subset 3 (247) | graph/common3.jpg |
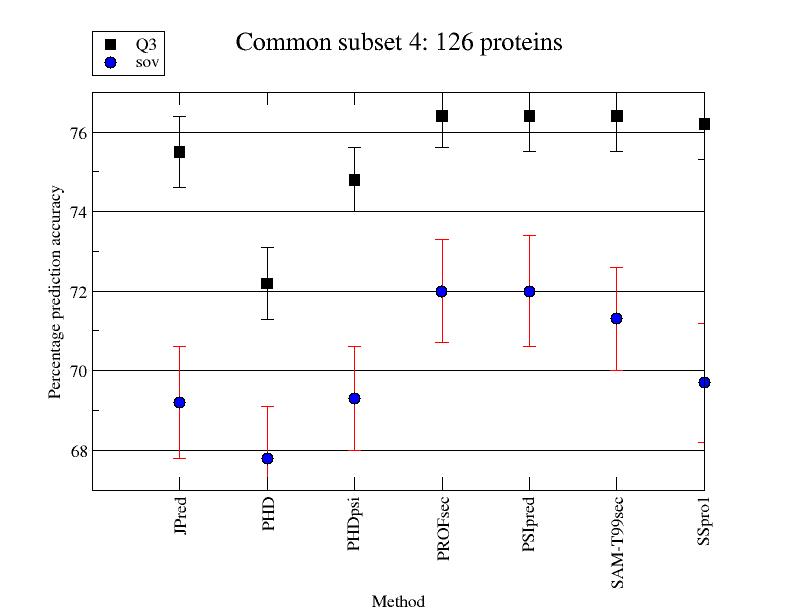
| Common subset 4 (302) | graph/common4.jpg |
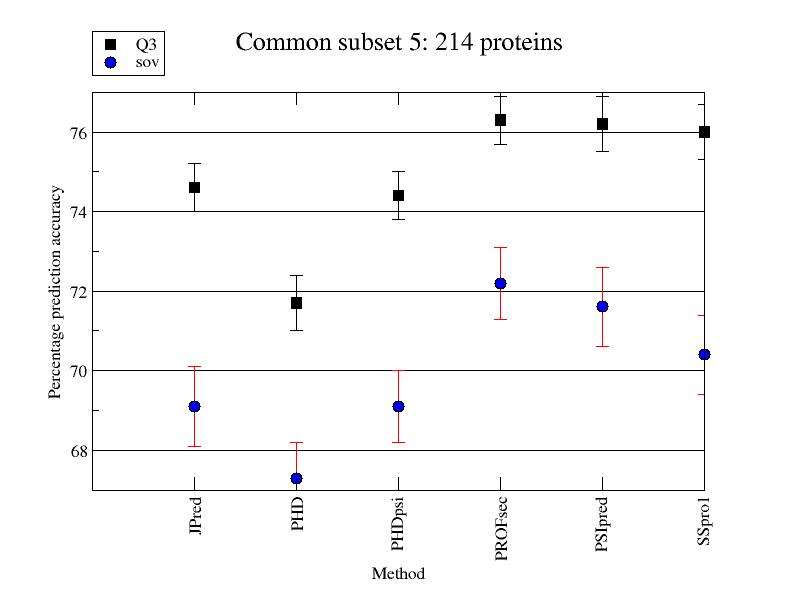
| Common subset 5 (302) | graph/common5.jpg |
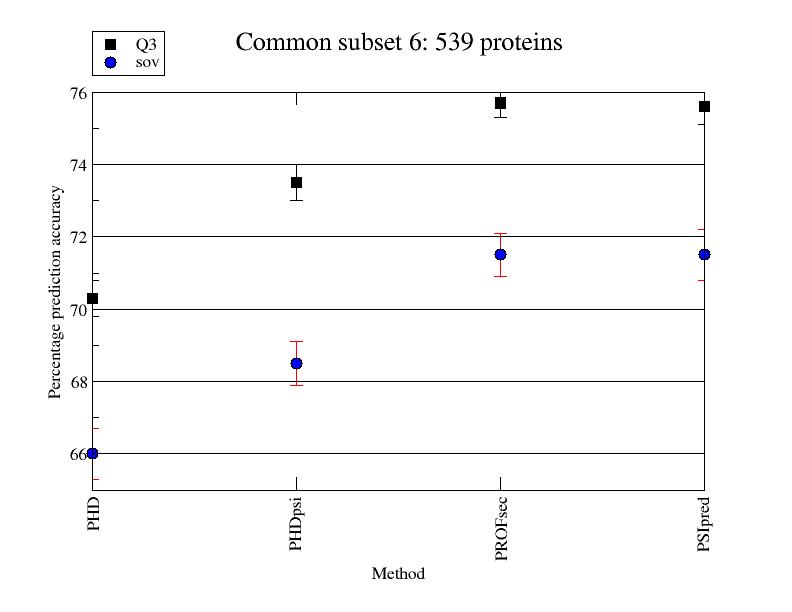
| Common subset 6 (567) | graph/common6.jpg |
| Method APSSP (1312) | graph/month_apssp.jpg |
| Method APSSP2 (672) | graph/month_apssp2.jpg |
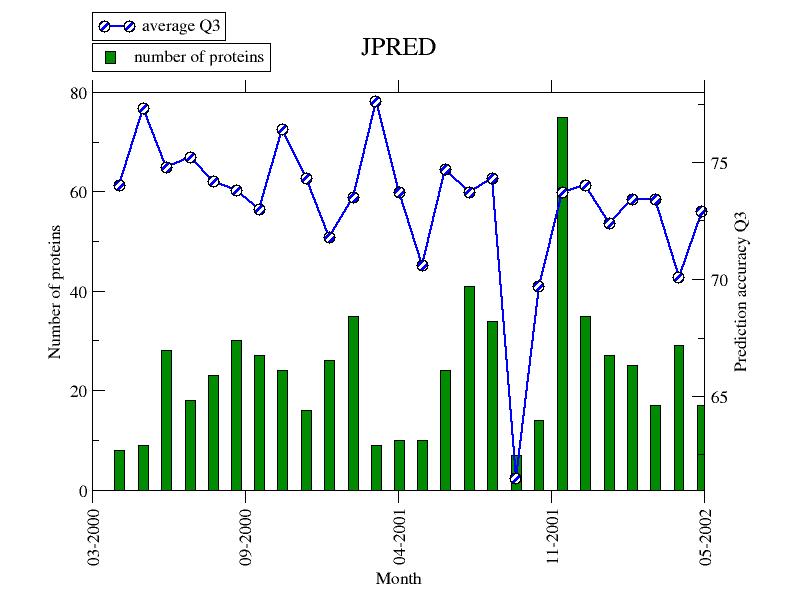
| Method JPred (1218) | graph/month_jpred.jpg |
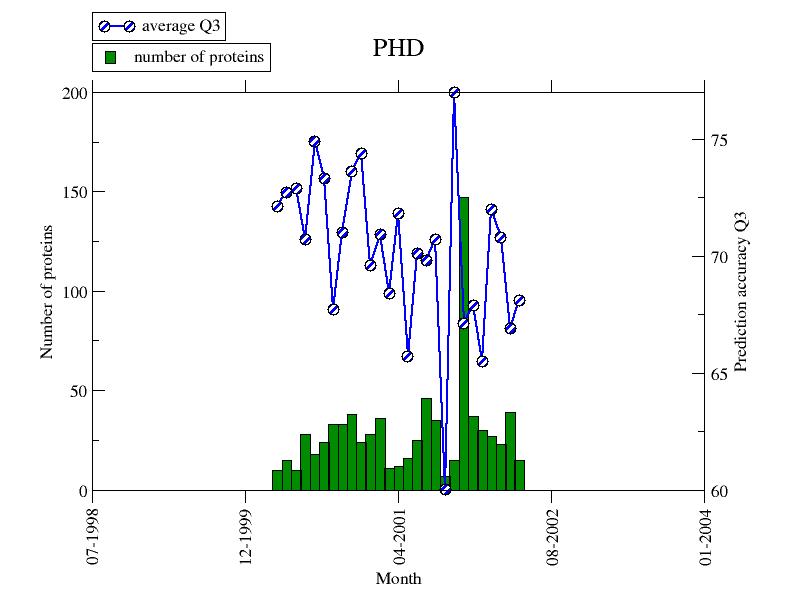
| Method PHD (1599) | graph/month_phd.jpg |
| Method PHDpsi (1598) | graph/month_phdpsi.jpg |
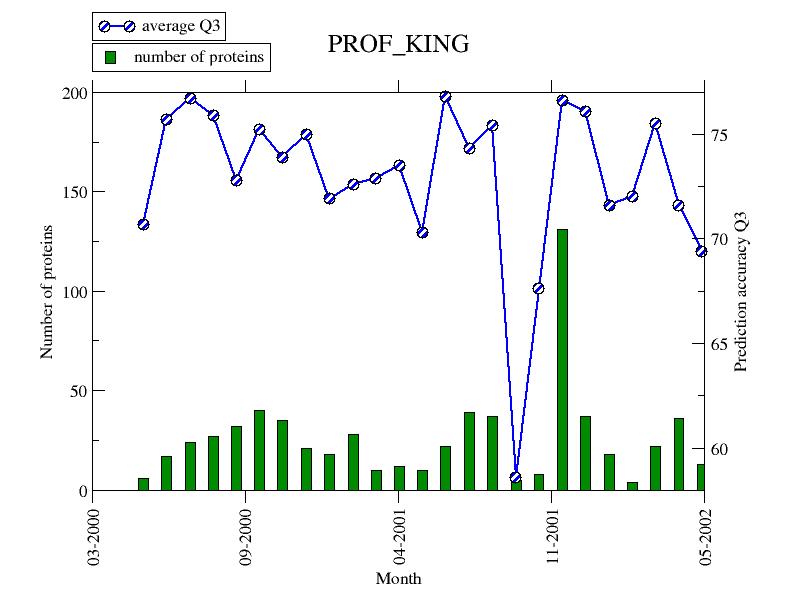
| Method PROF_king (1276) | graph/month_prof_king.jpg |
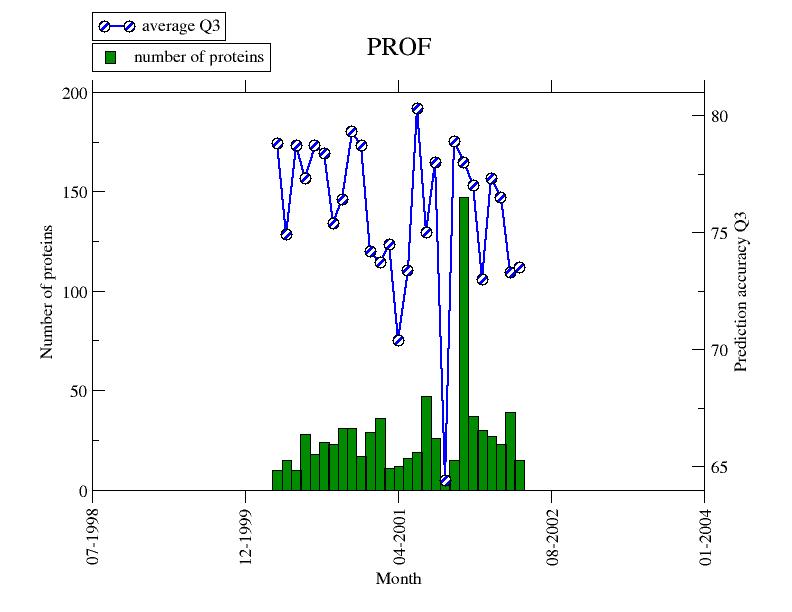
| Method PROFsec (1554) | graph/month_profsec.jpg |
| Method Prospect (103) | graph/month_prospect.jpg |
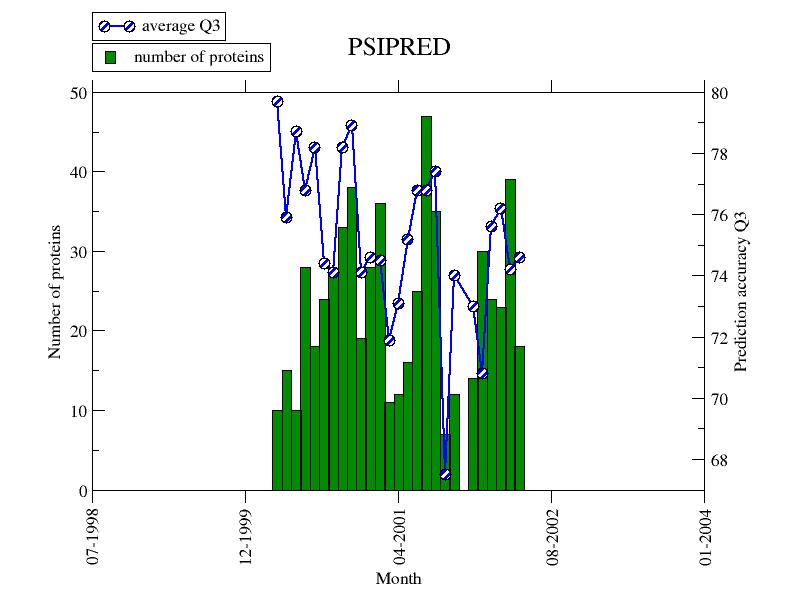
| Method PSIpred (1461) | graph/month_psipred.jpg |
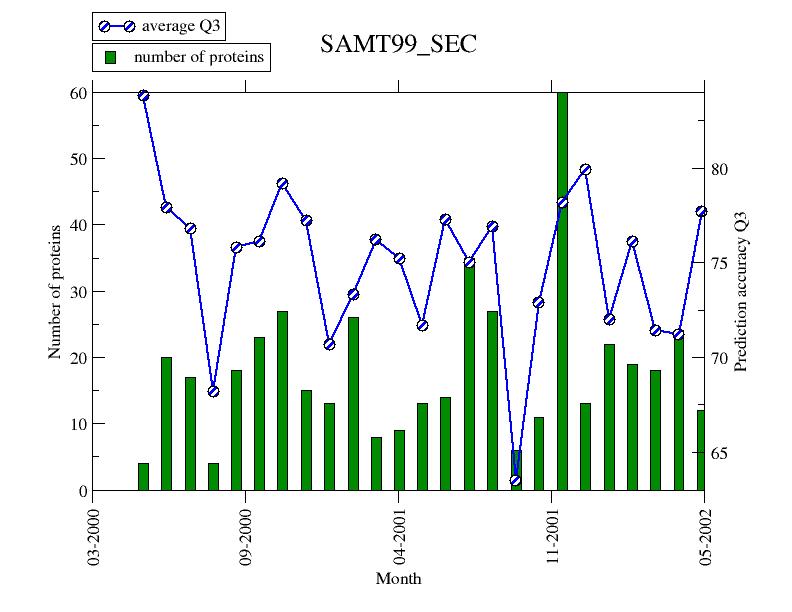
| Method SAM-T99sec (543) | graph/month_samt99_sec.jpg |
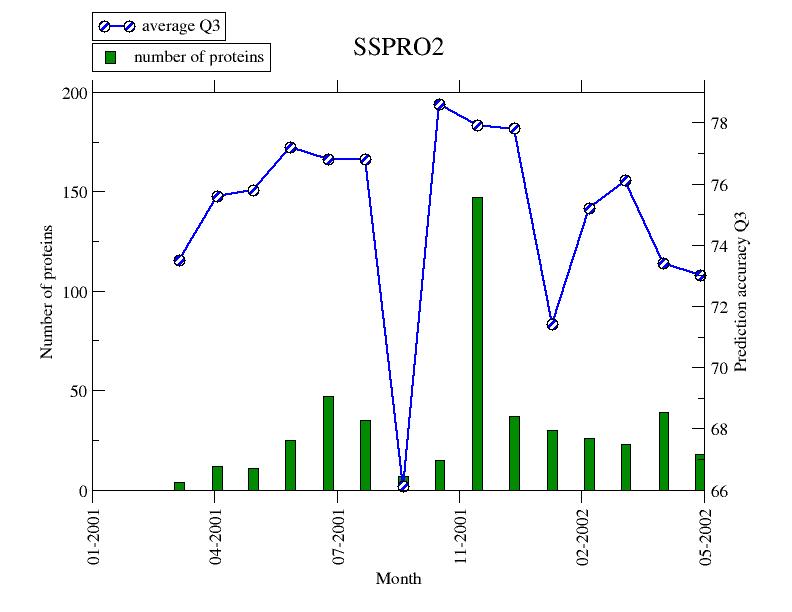
| Method SSpro2 (1348) | graph/month_sspro2.jpg |