Home
-
Secondary structure
Comparative modelling
Contacts
Threading
-
search
-
FTP
-
Mirrors
-
Bottom
Explain scores
EVA threading graphs
All graphs available:
All common subsets
ROC
curves (3 sets)
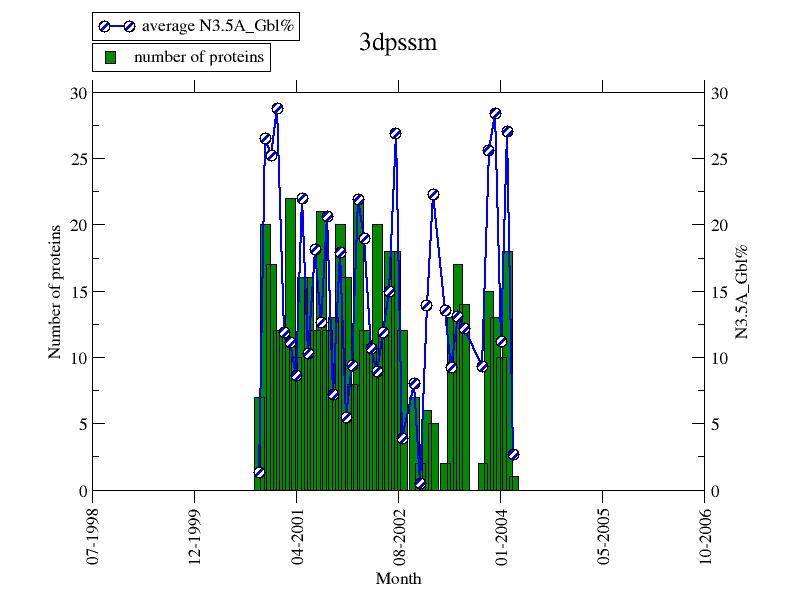
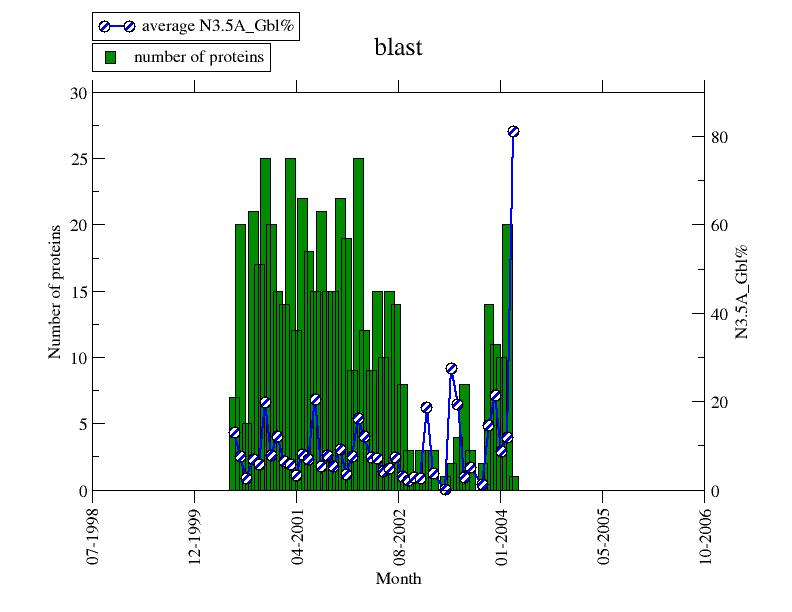
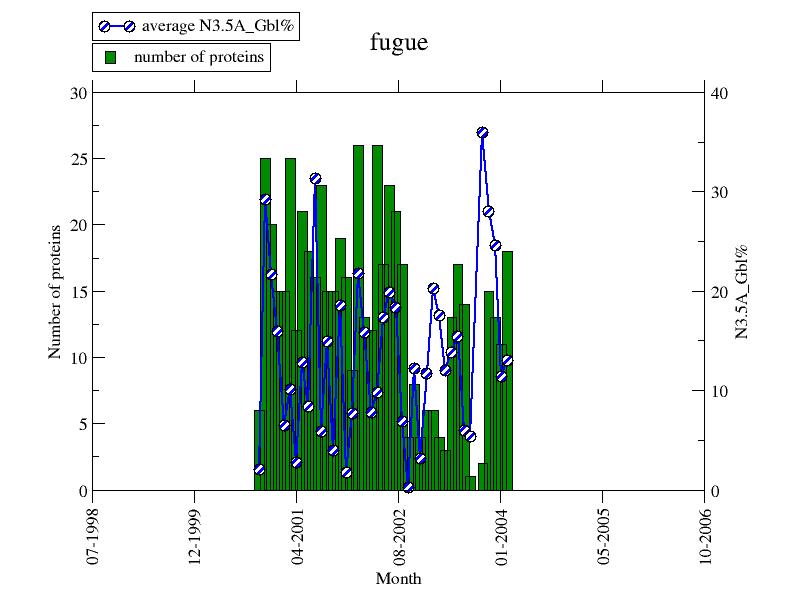
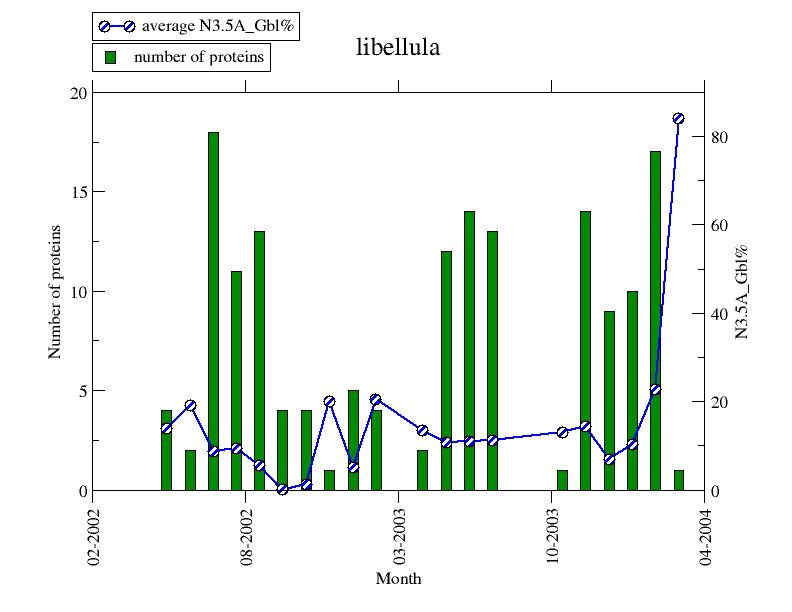
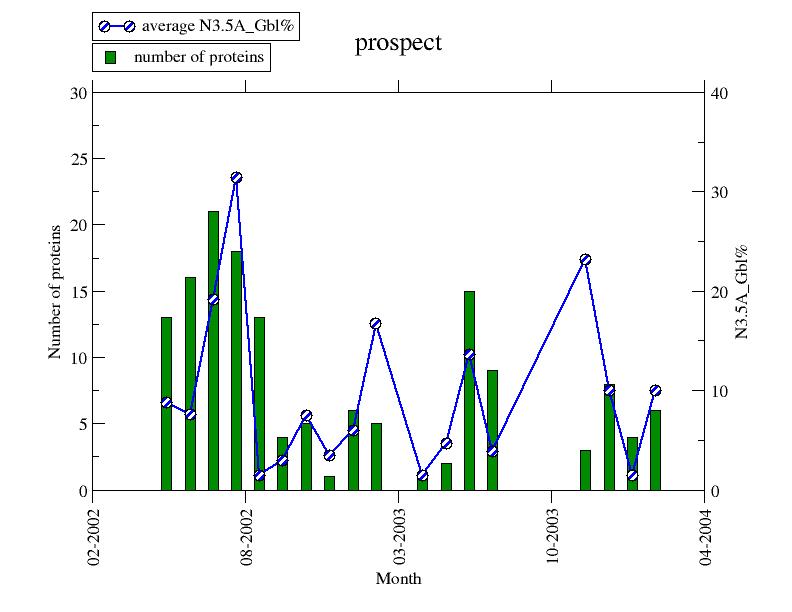
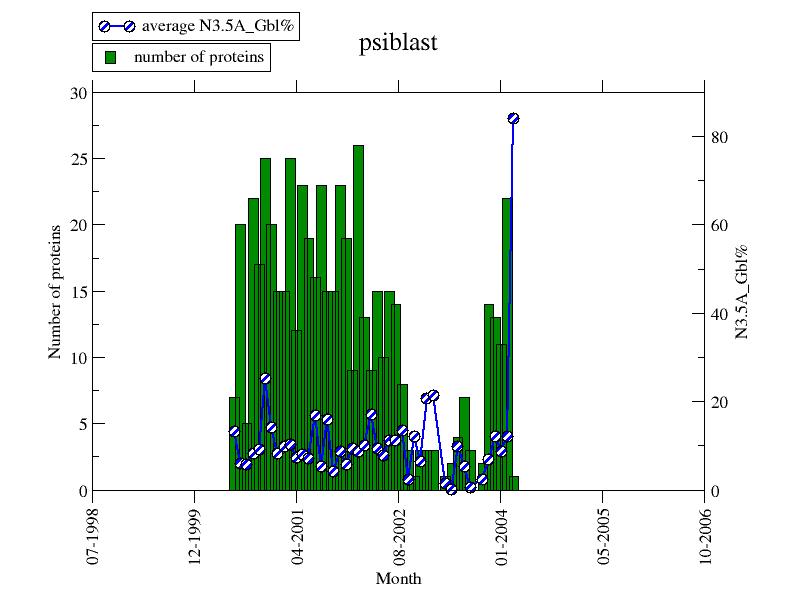
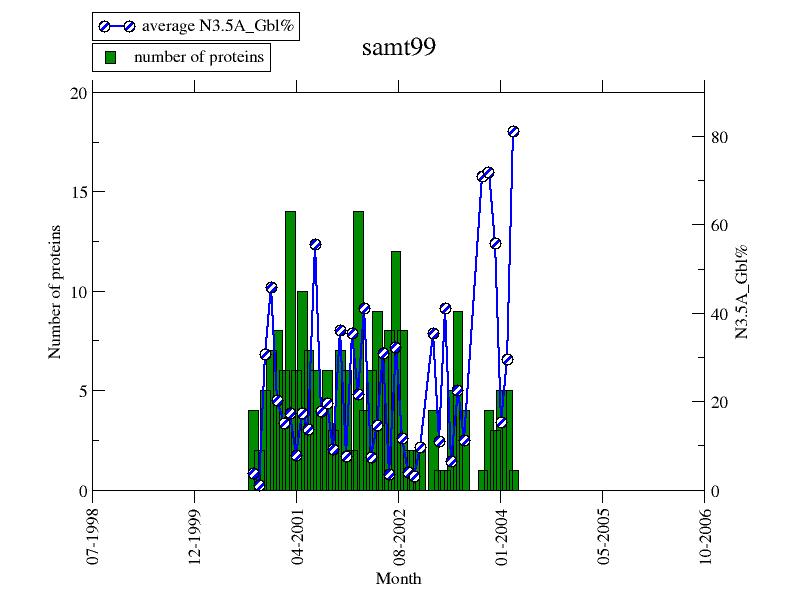
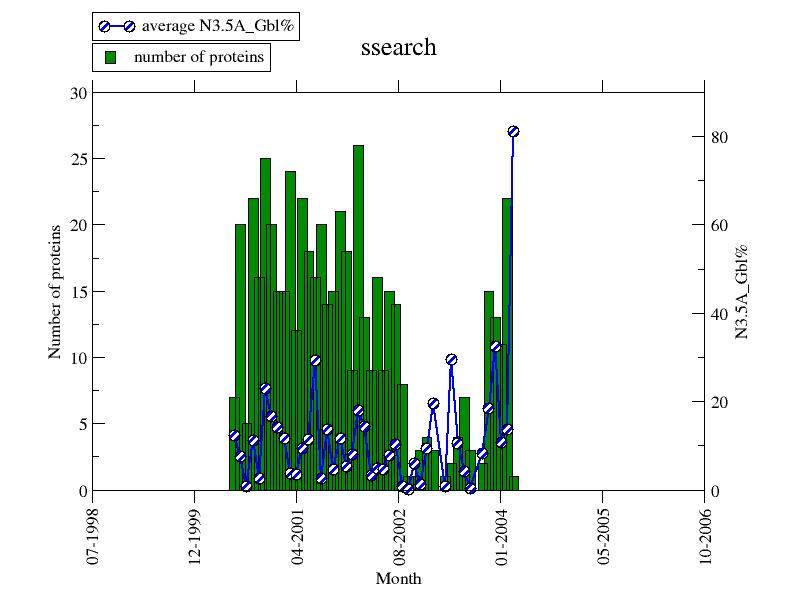
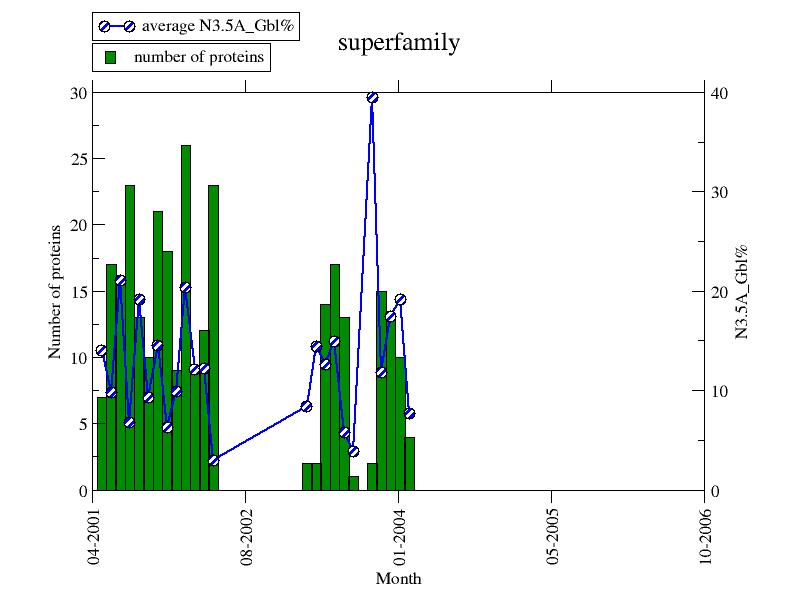
All methods per-month averages
for measure
N3.5A_Gbl%
(9 methods)
Particular graphs directly:
Note: numbers in brackets give number of proteins in respective graphs
Common subset 1
(15)
graph/-lnP_MMT/common1bestof1.gif
graph/Z_CE/common1bestof1.gif
graph/Q_LG1/common1bestof1.gif
graph/Q_LG2/common1bestof1.gif
Common subset 2
(66)
graph/-lnP_MMT/common2bestof1.gif
graph/Z_CE/common2bestof1.gif
graph/Q_LG1/common2bestof1.gif
graph/Q_LG2/common2bestof1.gif
Common subset 3
(133)
graph/-lnP_MMT/common3bestof1.gif
graph/Z_CE/common3bestof1.gif
graph/Q_LG1/common3bestof1.gif
graph/Q_LG2/common3bestof1.gif
Method
3D-PSSM
(484)
graph/month_3dpssmbestof1.jpg
Method
BLAST
(534)
graph/month_blastbestof1.jpg
Method
FUGUE
(564)
graph/month_fuguebestof1.jpg
Method
Libellula
(159)
graph/month_libellulabestof1.jpg
Method
Prospect
(150)
graph/month_prospectbestof1.jpg
Method
PSI-BLAST
(548)
graph/month_psiblastbestof1.jpg
Method
SAMt99
(220)
graph/month_samt99bestof1.jpg
Method
ssearch
(537)
graph/month_ssearchbestof1.jpg
Method
Superfamily
(297)
graph/month_superfamilybestof1.jpg
Last update: Mar 5, 2004
Contact:
rost@columbia.edu
WWW:
http://cubic.bioc.columbia.edu/eva
Explain scores
-
Home
-
Secondary structure
Comparative modelling
Contacts
Threading
-
search
-
FTP
-
Mirrors
-
Top