Home - Secondary structure Comparative modelling Contacts Threading - search - FTP - Mirrors - Bottom Explain scores
EVA fr per-subset graphs
Explanation:
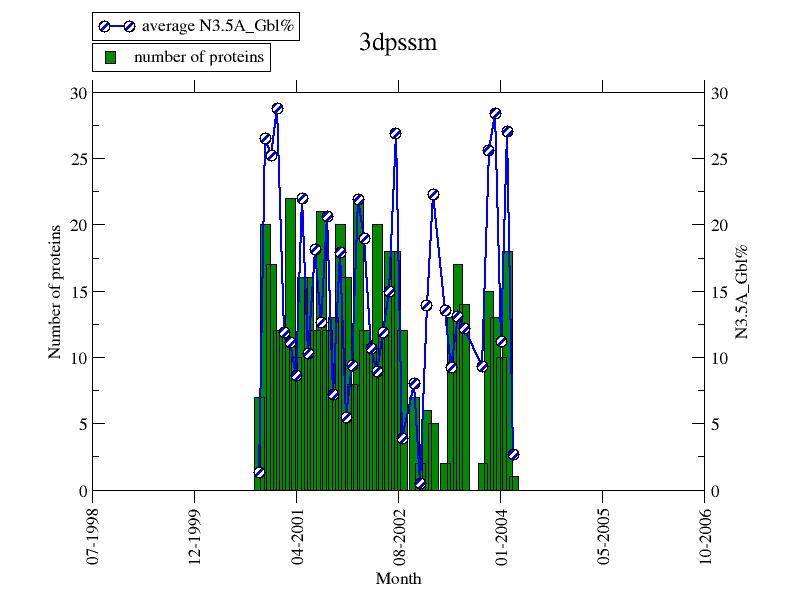
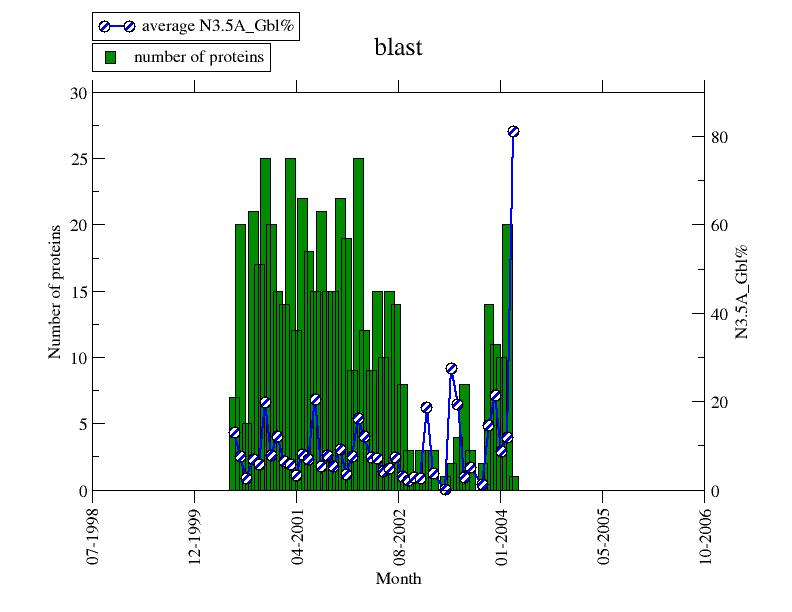
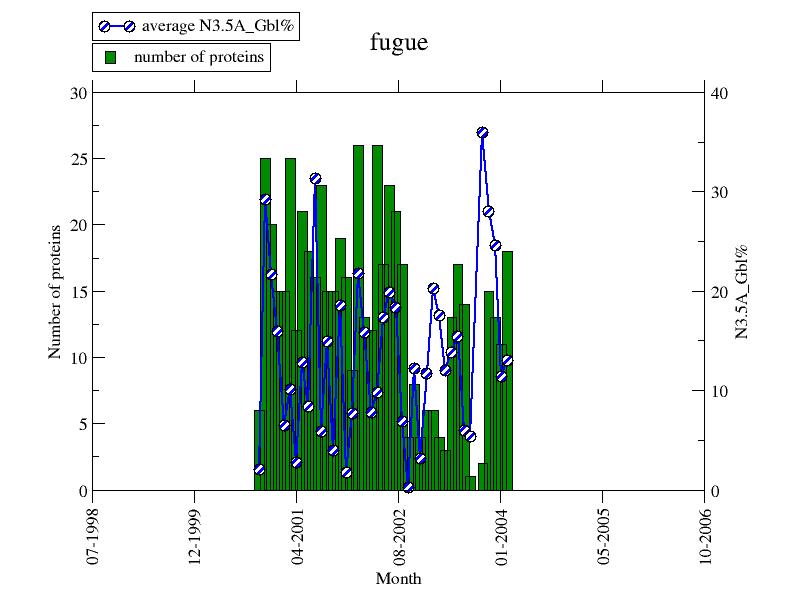
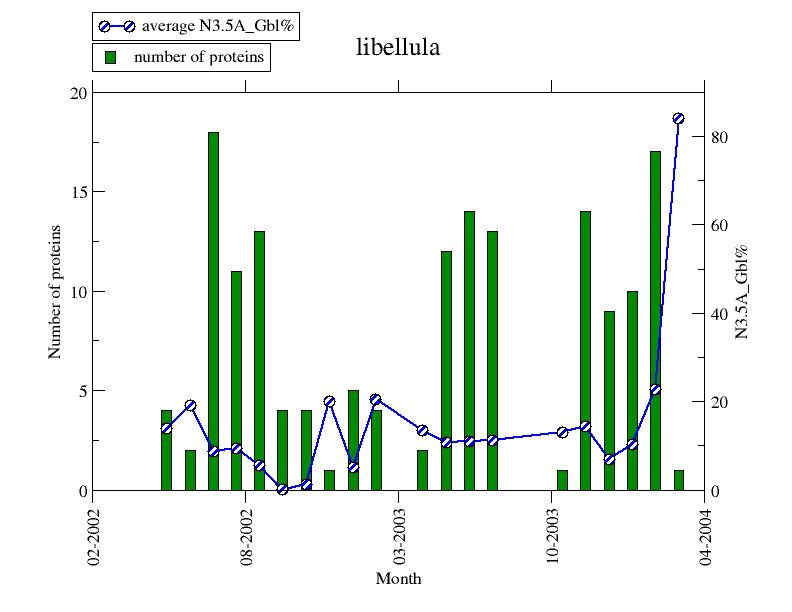
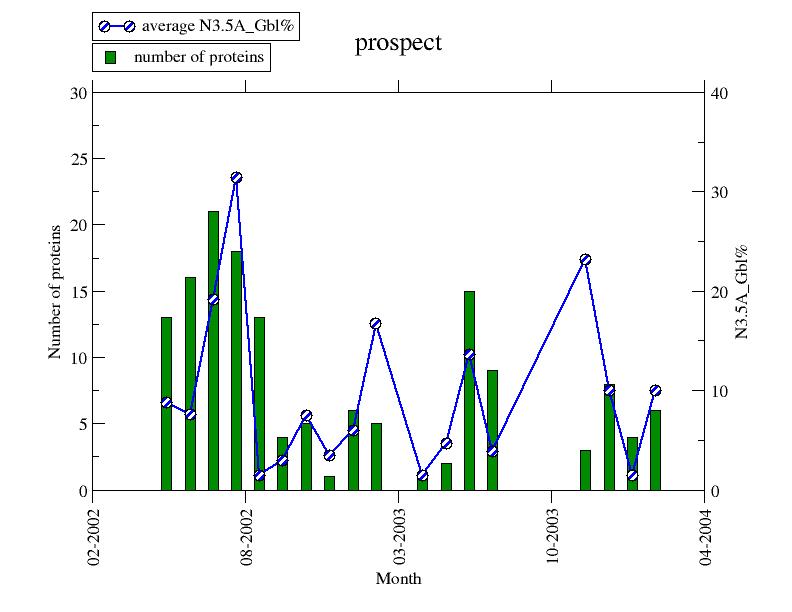
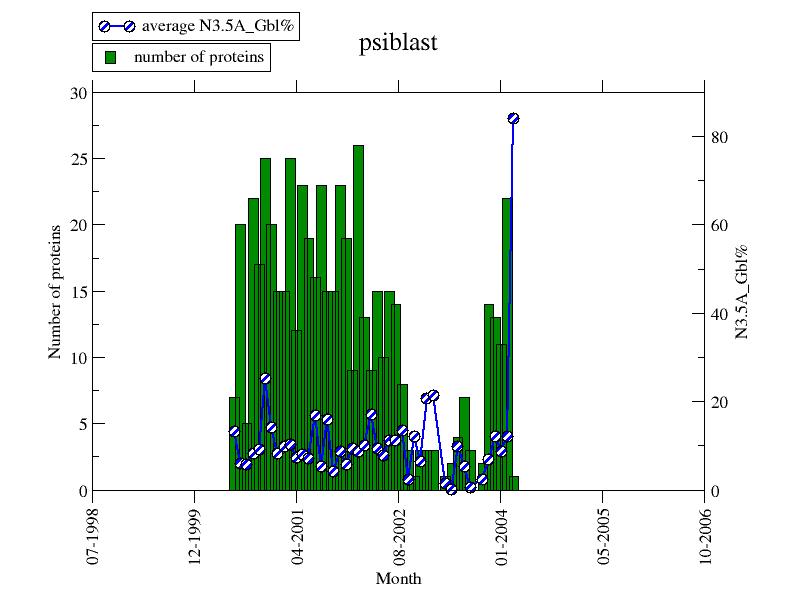
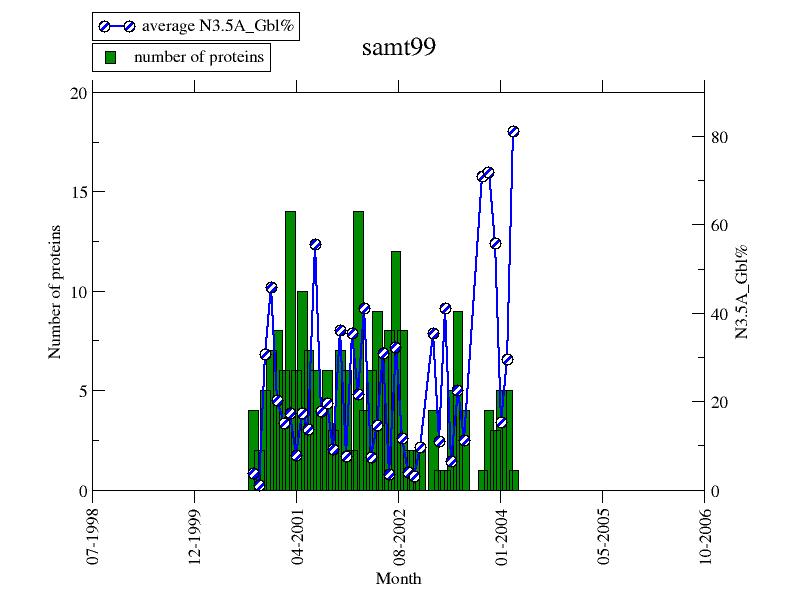
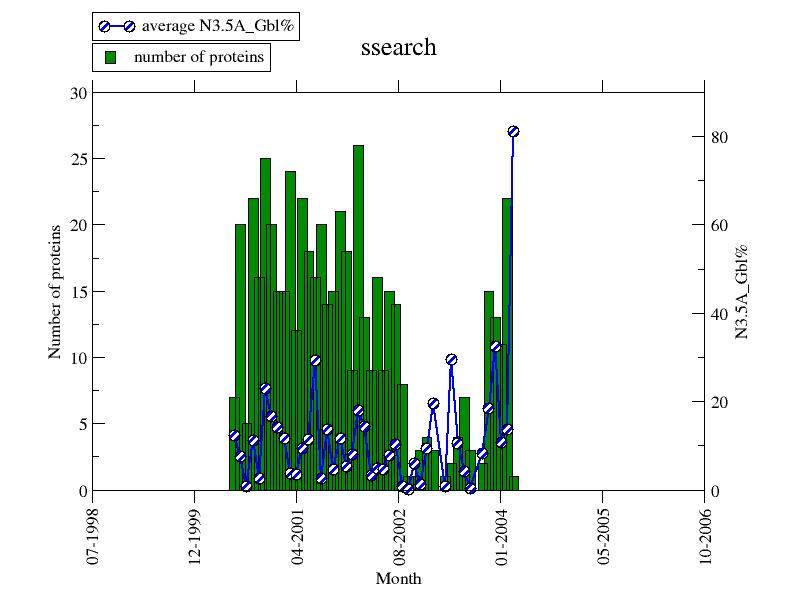
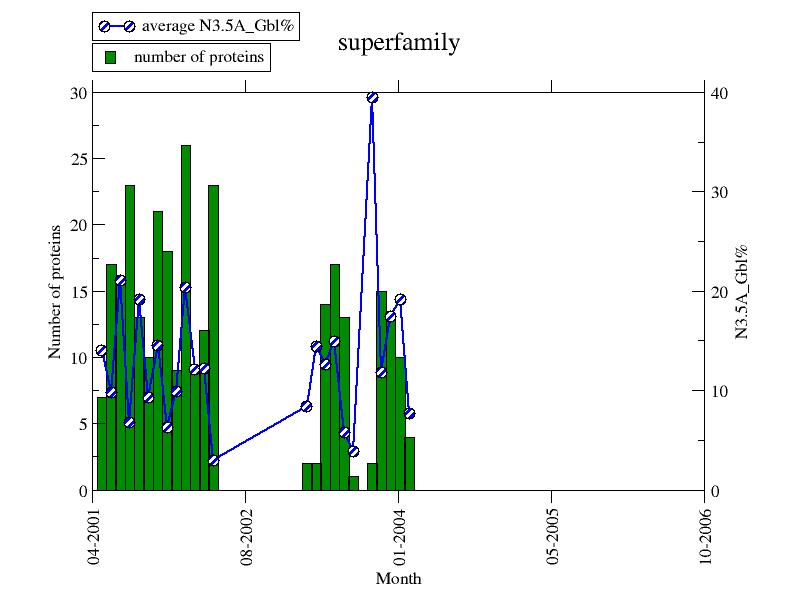
- For each method the
N3.5A_Gbl%
is shown for every month.
Note 1: results are not comparable between methods since they base on different data sets!
Note 2: methods are sorted alphabetically.
Monthly GRAPHS:
Explain scores - Home - Secondary structure Comparative modelling Contacts Threading - search - FTP - Mirrors - Top